Insights
J.S. Held Acquires Shechter & Everett to Expand Forensic Accounting Capabilities for Family Law Disputes in Florida
Read MoreThe material in this paper was jointly researched, compiled, and written by J.S. Held. It was originally published for attendees of the 31st Conference on Severe Local Storms in October 2024.
Historically, post-downburst research and damage surveys have been limited to damage assessments, review of nearby wind measurements and estimations, and weather radar review. However, there are limitations to each of these high-wind indicators, including differences in building materials, codes, and structural integrities, unknown tree and soil health (if trees are downed; e.g. Frelich and Ostuno 2012), overestimation of winds (Doswell et al. 2005; Edwards et al. 2018), lack of reliable nearby wind measurements (e.g. Horel et al. 2002), and limited-to-non-ideal radar base velocity imagery (e.g. Tirone et al. 2024).
Meanwhile, operational forecasters routinely utilize various atmospheric parameters to predict severe wind gust potential associated with downbursts, most notably downdraft convective available potential energy (DCAPE; Emanuel 1994), but also the wind index (WINDEX; McCann 1994), and T1/T2 indices (Fawbush and Miller 1954; Miller 1972), the microburst wind potential index (MWPI; Pryor 2015), among others. Radar-based methods including a comparison of 18 dBZ reflectivity echo tops to vertically integrated liquid (VIL) have been long-utilized in some environments (Stewart 1991), as well as peak wind gust relationships to outflow boundary propagation speeds (Sherburn et al. 2021). In some cases, even low-level radar base velocity scans of nearby high wind pockets can assist in determining surface wind speeds (Hjelmfelt 1988).
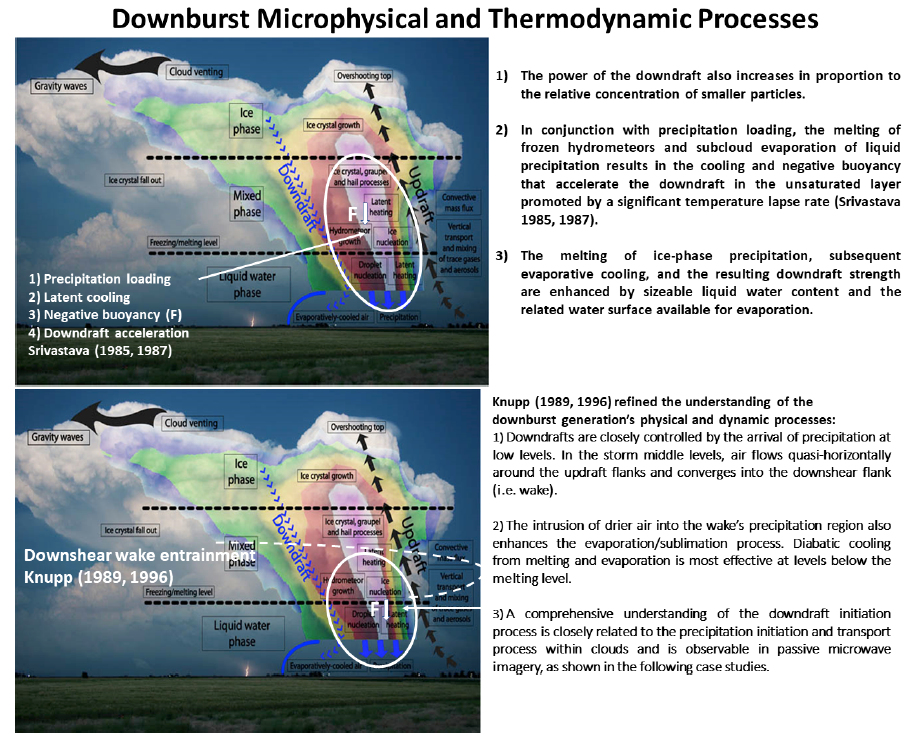
Figure 1 summarizes the favorable thermodynamic and dynamic factors that promote strong outflow wind generation: 1) precipitation loading, 2) latent cooling, 3) negative buoyancy (Fdown), 4) downdraft acceleration, 5) downshear wake entrainment, and 6) rear-flank circulation/rear-inflow jet.
Typically, in during daily forecasting operations, meteorologists are concerned with three categories of downburst wind speeds: sub-severe (< 50 knots), severe (50-64 knots), and significant severe (≥ 65 knots). Little attention is paid directly to a particular speed, other than those outlined placing the magnitude of the maximum gust into one of the three categories. Such categorization may be useful for warning purposes but identifying the true maximum gust speed (or range of speeds) is crucial for forensic purposes. This precision is due to implications for building codes, insurance claims, and other forms of liability (for example: construction defects, roofing installation errors, transportation safety, premises liability, etc.).
While each of these methods for operational forecasting downburst wind speed potential can also be utilized for forensic, post-storm analysis, the focus of this case study is on the applications of the highly adaptable MWPI to different storm modes within different climatic environments and different geographies.
The MWPI was first developed by Pryor (2010) and is designed to quantify the most relevant factors in convective downburst generation in by incorporating 1) surface-based or most unstable CAPE, 2) the temperature lapse rate between the 670- and 850-mb levels, and 3) dew point depression difference between the 670- and 850-mb levels. The MWPI is then incorporated into predictive linear and quadratic regression models and consists of a set of predictor variables (i.e., dewpoint depression and temperature lapse rate) that generates output of expected microburst risk and wind gust potential. In general, the MWPI algorithm is found to be most effective in assessing downburst wind gust potential associated with ordinary cell and multi-cell convective storms in weak wind shear environments.
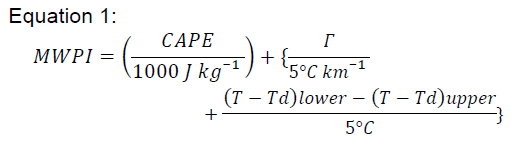
In Equation 1, 𝛤𝛤 represents the temperature lapse rate between the upper and lower pressure levels selected, which is based largely on the sub-cloud convective mixed layer in the parent environment. Traditionally, the MWPI has, by default, selected a layer of 850-670 mb for this layer based on Ellrod (1989) and Maddox et al. (1995; Pryor 2015). However, in higher elevation geographies, a 500-700 mb layer has been considered (Pryor and Miller 2016; Pryor 2017; based on Caplan et al. 1990), while in maritime, daytime environments, even surface or near-surface based convective mixing levels have been considered (e.g. Pryor 2016).
The unitless MWPI is then applied to either Equation 2 or Equation 3 (depending on geography) to result in a wind gust magnitude:
This adaptability and versatility to the local storm environment showcases the MWPI’s utility in a variety of geographies and convective modes, as the user of the index can customize the computation to match the most unstable atmospheric parcel in any scenario.
Such a customization is valuable to a post-storm, forensic analysis when a downburst is already known to have occurred. Instead of relying nearly entirely on damage indicators and their many documented limitations for localized wind speed estimations, meteorologists now have an accurate, adaptable tool at their disposal to environmentally estimate the maximum gust potential of a downburst.
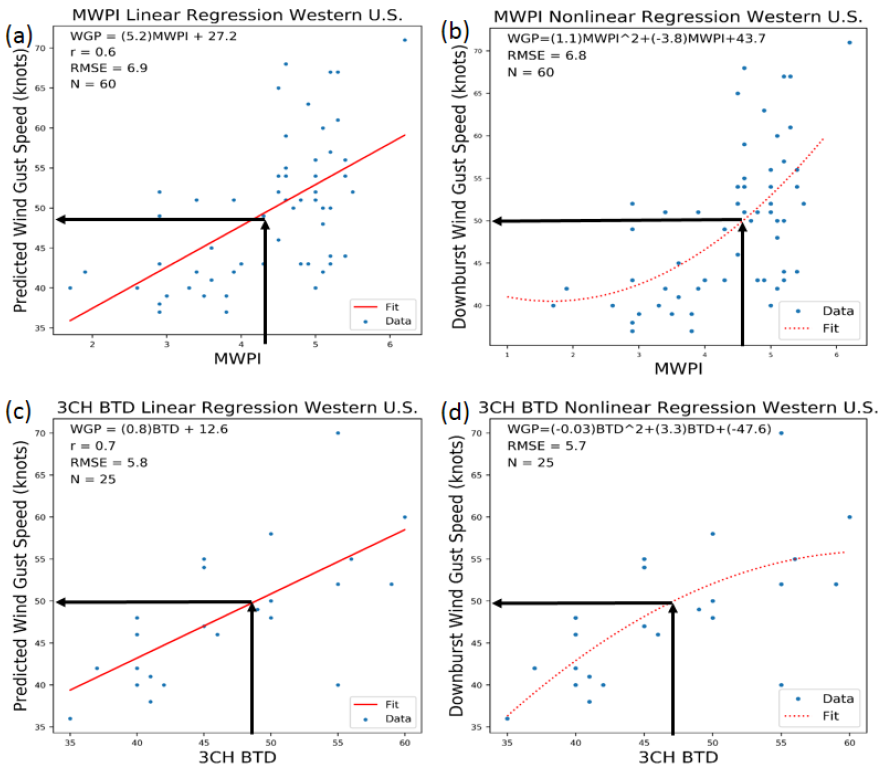
As demonstrated in Figure 2, MWPI-wind gust potential regression charts and attendant regression equations are derived by direct comparison between calculated MWPI values and associated proximate measured downburst wind gust speeds.
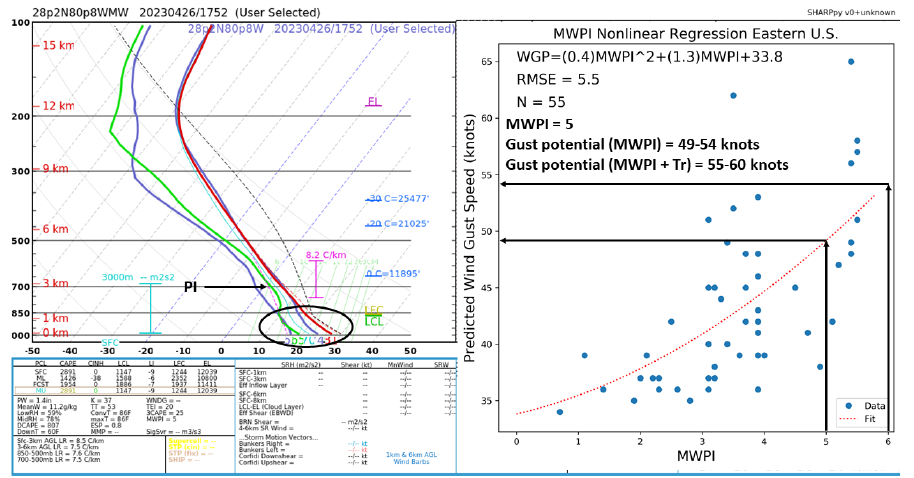
The NOAA-Unique Combined Atmospheric Processing System (NUCAPS) is an enterprise algorithm that retrieves atmospheric profile environmental data records (EDRs) and is applied and evaluated for both daytime and nocturnal severe convective windstorm cases. NUCAPS is also the primary algorithm for the operational hyperspectral thermal IR and microwave sounders. An example of the process of downburst wind gust potential diagnosis employing NUCAPS sounding profiles and regression charts is illustrated in Figure 3.
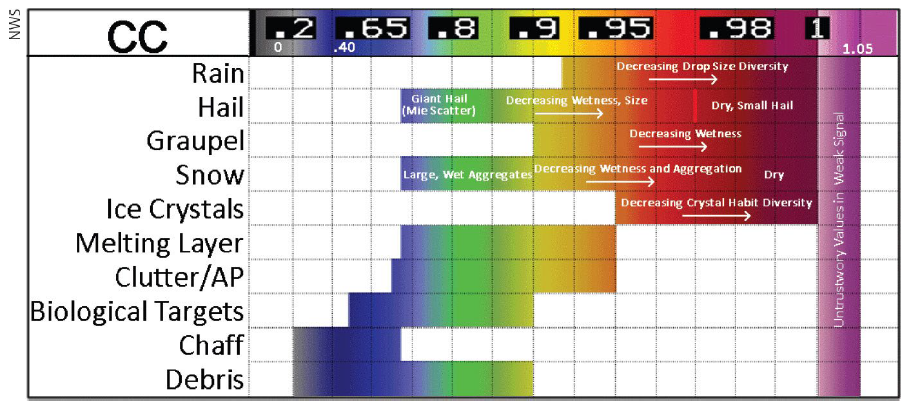
In addition, as shown in Figure 4, Correlation Coefficient (CC) is the measure of similarity of the radiative characteristics of horizontally and vertically polarized pulses emitted from dual-polarization Doppler radar. Precipitation characteristics, including particle phase and shape can be inferred by the coordinated use of CC and differential reflectivity (ZDR) measurements. Two distinct case studies are presented in which the versatility of the MWPI is showcased and supported by satellite-retrieved microwave (MW) brightness temperature (TB) measurements, Doppler radar reflectivity and CC signatures, and NUCAPS and GOES sounding (thermodynamic) profiles.
A dry microburst occurred near Carson City on the afternoon of 1 July 2014, resulting in a measured significant severe wind gust of 68 knots (78 mph) at the Little Valley remote automated weather station (RAWS; Zachariassen et al. 2003) at about 6,500 feet above sea level. This storm produced an outflow boundary which travelled into Reno, resulting in severe wind gusts, including a 59 knot (68 mph) wind gust at Reno-Tahoe Airport and a 62 knot (71 mph) wind gust at the Reno NWS office.
The 0000 UTC radiosonde from Reno indicated a virtual parcel MUCAPE of 357 J kg⁻¹, with a 9.676°C km⁻¹ lapse rate between the selected layers of 761-568.8 mb. A very strong “inverted-V” profile was exhibited, typical of dry downbursts, with nearly a 37°C surface dew point depression with a dry-adiabatic layer stretching from the surface to above 500 mb (Wakimoto 1985).
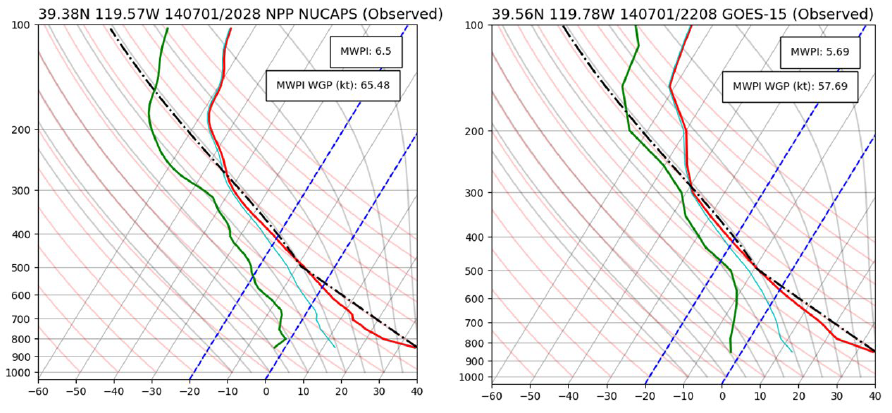
A unitless MWPI value of 5.7922 was calculated, and applied to Equation 3, resulted in a 59-knot potential wind gust. Once one-third of the forward storm motion was added (6 knots), a potential wind gust of 65 knots (75 mph) resulted. This is remarkably close to the 68 knots measured at the Little Valley RAWS. Shortly after this burst, the parent storm decayed and only the outflow boundary remained, still resulting in severe-caliber winds in the populated areas of the Truckee Meadows. The afternoon northwestern Nevada NPP NUCAPS and GOES sounding profile comparison shown in Figure 5 underscored the favorable environment for dry microbursts by exhibiting a classic Miller (1972) Type 4 or Wakimoto (1985) Type A (“inverted-V”) profile that promoted downdraft acceleration below the melting level and thunderstorm cloud base and subsequent intense straight-line winds at ground level.
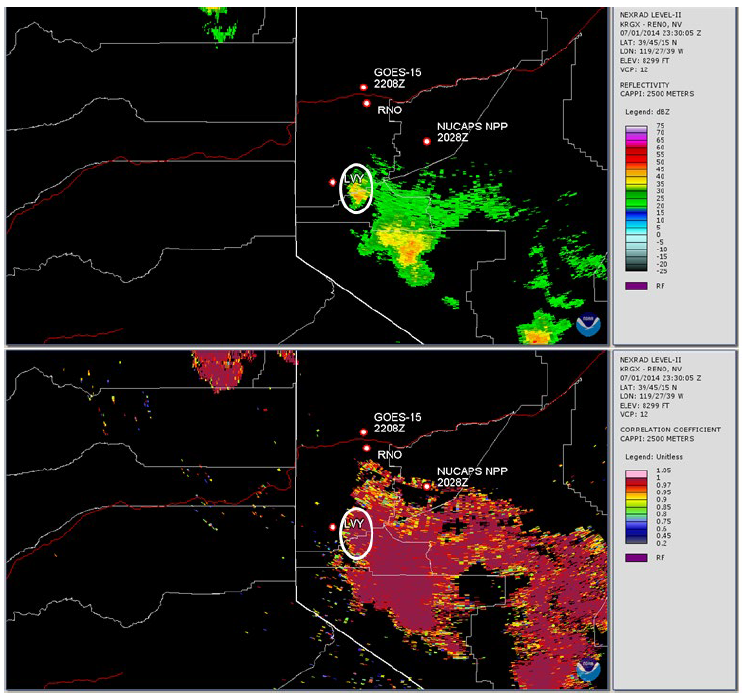
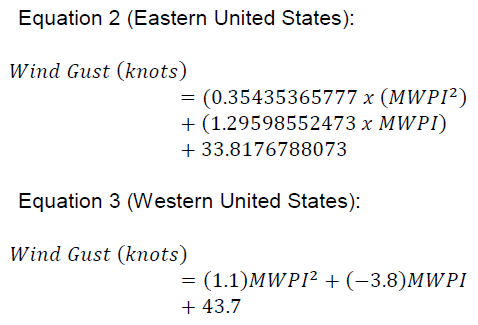
The 2327 UTC NOAA-18 Microwave Humidity Sounder (MHS) 89 GHz brightness temperature as compared to the 157 GHz scattering index in Figure 6, closest to the time of occurrence of the Little Valley downburst at 2338 UTC, showed correspondingly low MW brightness temperatures and relatively high scattering index values associated with the parent storm. In addition, the Reno, Nevada NEXRAD imagery in Figure 7 showed the coincident occurrence of high reflectivity and relatively high correlation coefficient values (near 1.0) within the precipitation core of the storm that signified the presence of dry graupel, small hail and ice crystal aggregates. This precipitation composition of the storm promoted a large amount of latent cooling and resulting negative buoyancy in accordance with the process described in Figure 1.
A long-track high-precipitation (HP) supercell thunderstorm moved across Brevard, Indian River, St. Lucie, and Martin Counties Florida on the afternoon and evening of 26 April 2023. This supercell resulted in several reports of significant-severe wind gusts and surveyed wind damages, published in the NOAA Storm Events Database. This storm resulted in an area of damage in West Melbourne (Brevard County) in which the National Weather Service (NWS) determined was between 70-75 miles per hour (mph). Specifically mentioned within this damage survey was a nearby measured wind report from a personal weather station (PWS) of 62 knots (71 mph).
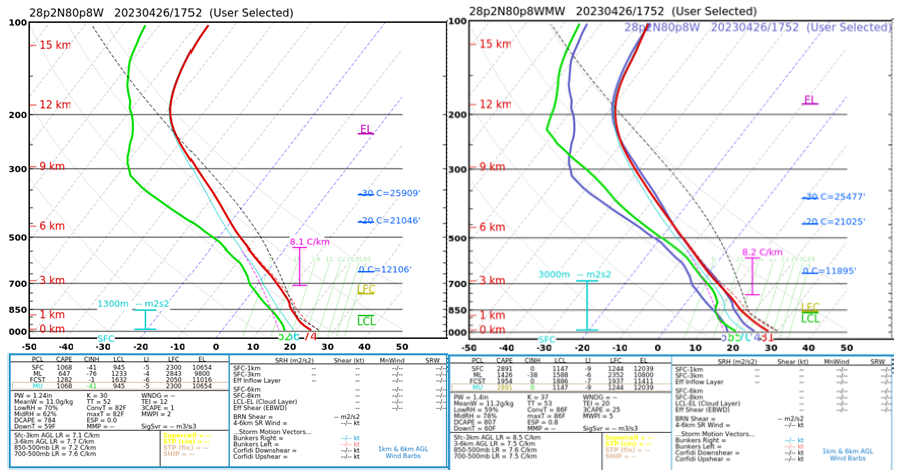
Utilizing a virtual parcel most-unstable CAPE (MUCAPE) from the 1500 UTC Cape Canaveral radiosonde of 5,451 J kg⁻¹ and temperature and dew point measurements from the 925-753 mb levels (including a lapse rate of 6.18°C km⁻¹), a unitless MWPI of 6.3065 was obtained. This resulted in a downburst wind gust speed potential of 56 knots. Adding one-third of the radar-measured forward storm motion (in general relation to the method of adding one-third of the surface-5,000-foot mean wind speed to overall downburst speed recommended by Miller (1972)), a resultant 62 knots was established – identical to that measured by the personal weather station located proximate to the downburst swath surveyed by the NWS. Figure 8, the early afternoon (1752 UTC) NOAA-20 NUCAPS physical (IR+MW) and MW-only soundings, retrieved near Melbourne, displayed a classic moist Miller (1972) Type 2 profile with large CAPE, conditional instability, and an MWPI value of 5 that corresponded to downburst wind gust potential of 50 knots or greater. The wet-bulb zero height near the 700 mb level was conducive for hail and subsequent intense downdraft generation.
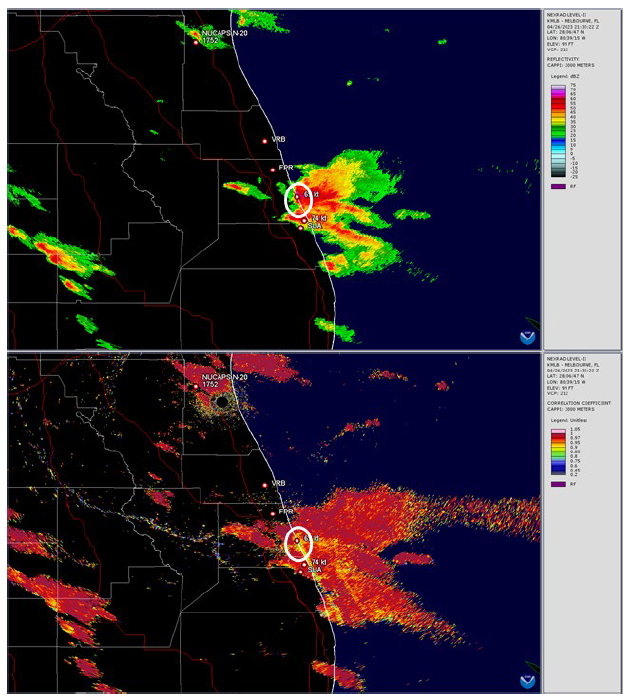
Additional downburst wind gusts were recorded at Vero Beach (56 knots at 2042 UTC) and Fort Pierce (47 knots at 2103 UTC) airports, and the strongest of the event was recorded at Jensen Beach Weatherflow station (74 knots at 2146 UTC). The late afternoon (2132 UTC) DMSP F-18 SSMIS sensor overpass, shown in Figure 9, was optimal for observing the physical characteristics of the supercell storm that favored downburst generation. Melbourne NEXRAD imagery in Figure 10 showed the coincident occurrence of high reflectivity and relatively low correlation coefficient values (0.8-0.9) within the precipitation core of the storm that signified the presence of a large graupel and hail content. A high concentration of ice-phase precipitation in the rear flank of the storm favored intense downburst generation that was promoted by a large amount of latent cooling and resulting negative buoyancy in accordance with the process described in Figure 1.
The MWPI can be demonstrably employed in any situation where convective downdraft and/or downburst activity is suspected due to its versatility and adaptability across various geographies, climate zones, and convective modes.
The MWPI has also been utilized internationally, including with documented positive results in Australia (Grundstein et al. 2017), as well as in the United Kingdom (currently ongoing). Even the 16 April 2024, historic rainfall and severe weather event in the United Arab Emirates (UAE) indicated reliable uses of the MWPI originating both from observed polar-orbiting meteorological satellite sounders as well as measured radiosondes from Abu Dhabi.
This versatility of the MWPI is due to the customizable nature of the index’s variables. For example, the user may define specific atmospheric levels corresponding with the steepest sub-convective-cloud base layer lapse rates, and equations are presented to determine a maximum wind gust speed based on western and eastern U.S. geographies (though we suspect that these can apply anywhere in the world with similar geography and climate zones).
We also have introduced the recommended, demonstratively accurate method of applying one-third of the radar-measured forward storm motion to the organic wind gust speed obtained through the MWPI equations, as this method further adapts the MWPI wind gust speed to the parent storm itself.
In general, afternoon NPP and NOAA-20 NUCAPS soundings qualitatively indicate a strong signal for severe thunderstorm and downburst occurrence: 1) close agreement between the boundary layer structure ("inverted-V") as resolved by the GOES and NUCAPS sounding profiles and the calculated MWPI gust potential; 2) strong relationship between high radar reflectivity and very low MW brightness temperatures (BTs) apparent in NOAA-18 and F-18 satellite overpasses; 3) low BTs also correspond well with the high integrated graupel values, suggesting that intense downdrafts and resulting downbursts were forced by ice precipitation loading and melting, as well as unsaturated air entrainment into the mixed-phase precipitation core.
The NEXRAD correlation coefficient product effectively distinguished between dry graupel, small hail and ice crystal aggregates that were predominant in the western Nevada downburst storm and the presence of larger, melting graupel and hail that was prevalent in the Florida supercell storms. Accordingly, the Florida storms exhibited an increased favorability for severe downburst generation.
We would like to thank our colleagues Kenneth Pryor, PhD and Daniel Schreiber, CCM for providing insights and expertise that greatly assisted this research.
Daniel Schreiber is a Senior Vice President in J.S. Held's Forensic Meteorology service line. He is a Certified Consulting Meteorologist with over 10 years of experience in military, aviation, and severe weather operations. Mr. Schreiber has provided consulting and expert services for both plaintiff and defense law firms, as well as insurance adjusters, appraisers, umpires, and policyholders throughout North America. He has been consulted and/or retained as an expert in over 850 matters and has testified in both depositions and during trials in state and federal courts. He regularly plays an integral role in multi-million-dollar insurance disputes and injury/wrongful death lawsuits from coast to coast. Before joining J.S. Held, Dan was a highly successful meteorology business owner.
Dan can be reached at [email protected] or +1 830 453-0255.
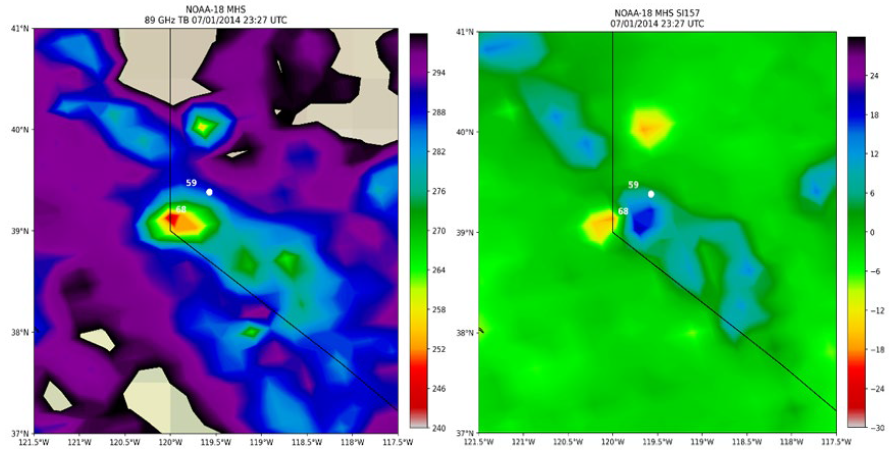
Figure 6 - 2327 UTC 1 July 2014 NOAA-18 Microwave Humidity Sounder (MHS) 89 GHz brightness temperature (left) compared to the 157 GHz scattering index (right). White circle represents the 2028 UTC NPP NUCAPS retrieval location. “59” and “68” mark the locations of downburst wind gusts of 59 knots and 68 knots recorded at Reno-Tahoe Airport and Little Valley RAWS, respectively.
Figure 9 - 2132 UTC 26 April 2023 DMSP F-18 SSMIS brightness temperature product comparison. “PCT” is the polarization-corrected temperature and “SI89” is the 89 GHz scattering index. White circle represents the 1752 UTC NOAA-20 NUCAPS retrieval location. “56”, “47”, and “74” represent downburst wind gusts (knots) recorded at Vero Beach, Fort Pierce, and Jensen Beach, Florida, respectively.
Wind events are generally characterized as straight-line winds; however, some are isolated and short-lived, while others are not. But what’s the difference?...
Consulting with a professional meteorologist regarding reported (or conversely, unreported) storm events is fundamentally crucial to understanding a storm’s occurrence (or lack thereof) for insurance claims. Find out why....
We discuss hazardous weather events by geography in the US, and why considering these events is important for understanding underwriting risks and handling post-storm insurance claims....