Insights
J.S. Held Acquires Shechter & Everett to Expand Forensic Accounting Capabilities for Family Law Disputes in Florida
Read MoreThe material in this paper was researched, compiled, and written by J.S. Held. It was originally published by SAE International.
Photoscanning photogrammetry is a method for obtaining and preserving three-dimensional site data from photographs. This photogrammetric method is commonly associated with small Unmanned Aircraft Systems (sUAS) and is particularly beneficial for large area site documentation. The resulting data is composed of millions of three-dimensional data points commonly referred to as a point cloud. The accuracy and reliability of these point clouds is dependent on hardware, hardware settings, field documentation methods, software, software settings, and processing methods. Ground control points (GCPs) are commonly used in aerial photoscanning to achieve reliable results.
This research examines multiple GCP types, flight patterns, software, hardware, and a ground based real-time kinematic (RTK) system. Multiple documentation and processing methods are examined, and accuracies of each are compared for an understanding of how capturing methods will optimize site documentation.
Disclaimer: this paper is not intended to endorse any of the specific products/brands/manufacturers mentioned in the paper or used in the study.
Since their entry into the marketplace, drones have been adopted into accident reconstruction in various ways. Aerial drones have been used by police to record scenes shortly after an accident while evidence is still present and have been used to document a site long after an accident has occurred to get additional information. Drones have been deployed to track vehicle movements during testing and analysis [1-3]. Aerial photos and video from drones offer unique perspectives from above that present data in a way that would otherwise be lost if solely captured from ground-level cameras. Using an unmanned aerial vehicle in nighttime conditions, Funk was able to aerial photograph the illumination on the ground of a mapped vehicle headlamp [4]. Drones have been used to show vehicle dynamics of motorcycles and passenger vehicles during turns [5-7]. Unmanned aerial vehicle use in accident reconstruction is becoming an essential tool of the trade. Advancements in technology continue to alter the way that small Unmanned Aerial Systems are used in the accident reconstruction community.
Scene mapping in accident reconstruction is one way that sUAS have emerged as a valuable piece of equipment to aid an accident reconstructionist. Large areas of land can be rapidly documented with photographs from above by an unmanned aerial vehicle (UAV). Using photogrammetry, the aerial photographs can be combined and implemented into a site diagram. The inclusion of onboard Global Positioning System (GPS) modules to track and correct a UAV’s flight expands the ability for a camera’s location to be precisely located for use in the diagram process. Land surveyors have integrated sUAS with GPS positioning for site mapping [8]. Accident reconstruction can benefit from the developments in positional accuracy from GPS positioning methods.
Global positioning receivers, like those incorporated in sUAS, “have been achieving horizontal accuracy of 3 meters or better and vertical accuracy of 5 meters or better 95% of the time” [9]. While this level of accuracy is respectable and suitable for many applications, increased accuracy of GPS signals is welcomed in accident reconstruction and can be achieved by incorporating additional data to the standard GPS receiver. In 1997, Van Diggelen reported higher than GPS-level accuracy by utilizing real-time kinematic (RTK) technology in collecting positional data [10]. Later research from Desai substantiates the use of RTK devices in addition to GPS by tracking bicycle paths in narrow lanes of roadways. Desai’s inclusion of an RTK base station as a control point for the GPS receiver that was mounted on the bicycle gave greater accuracy in his testing than GPS alone [11].
Previous published research by Carter reveals the accuracy of drone GPS methods, including PPK technology, and use of ground control points for capturing aerial photographs and processing them with available photogrammetry software. His research validates the need for using ground based coordinates with higher than GPS level accuracy to achieve a precision closer to traditional survey and LiDAR scanning methods. Carter’s research involves ground control point data derived from various sources within a closed parking lot [12]. The research presented in this paper expands on ground control point usage and includes RTK technology with drone mapping solutions for a longer roadway with an intersection that could be typical of an accident scene.
Real-Time Kinematics
Real-time kinematics is a method for determining positions from the Global Navigation Satellite System (GNSS) [13]. RTK enables the GNSS operator to collect centimeter-accurate survey data. With Base and Rover RTK positioning, two RTK receivers work in tandem to record locational data. A fixed-position receiver, known as the base station, is established as a known position and continuously compares this position against new solutions to calculate a correction matrix. This correction matrix is broadcast to roving receivers in the area to compensate for errors caused by atmospheric interference. Similarly, rovers can be configured to accept correction data from established correction networks over an internet connection. This is known as Networked Transport of RTCM via Internet Protocol (NTRIP). In such cases, a base station is not required on site.
Post-Processing Kinematics
Post-processing kinematics (PPK) for sUAS land mapping with ground control points is a system of collecting positional data to map a site and then revising the positional data through a GPS correction network [14]. Unlike RTK, which gathers coordinates and corrects the geolocational data in real-time from a base station, post-processing kinematics uses GPS receivers to gather and store coordinates but does not make corrections to the data until a later time. This workflow allows for a choice of an available correction algorithm to be used to correct the atmospheric conditions in the adjustment of geolocational data. PPK ground control point acquisition does not require an additional base station or connection to a network of correctional data while gathering GPS points. Signal loss from additional transmitters is not an issue with PPK ground control points. However, the receivers require a consistent satellite signal from the sky. PPK methods can improve GPS coordinates to centimeter level accuracy.
Various equipment exists for taking measurements at an accident site. Though testing was performed with specific equipment, other manufacturers are expected to produce similar results to the hardware listed in this testing.
Emlid Reach RS+ RTK Receivers
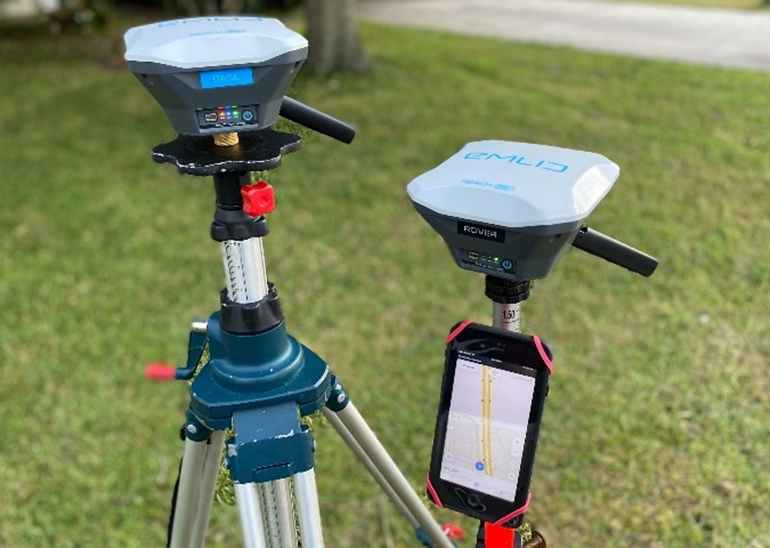
The Emlid Reach RS+ is a multi-constellation, survey-grade GNSS receiver that pairs with a mobile application for user control. These receivers are capable of being launched in Base or Rover mode and can accept correction data from local base stations as well as NTRIP services. In the Base and Rover configuration, correction data can be transmitted to the rover via Long Range (LoRa) radio. The base station’s fixed position can be manually entered during setup or can be determined by averaging solutions over a user-defined time period (Figure 1).
Propeller AeroPoint PPK Ground Control Points
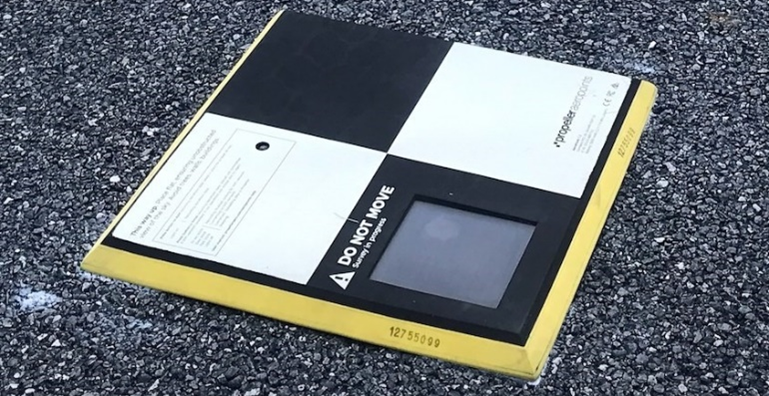
A Propeller AeroPoint is a portable global positioning system receiver that collects and stores the coordinates of its location. Multiple AeroPoints typically are used together or with other ground control points to scale and orient a mapped site. They have four 10x10 inch contrasting white and black squares that are observable as a crosshair pattern from an aerial perspective (Figure 2). The intended purpose of AeroPoints is to place them throughout the mapped site with an unobstructed view of the satellites and the UAV that will be photographing the site. Post-processing the locational data from the GPS receiver is achieved through the Propeller Correction Network. After processing, the AeroPoint data has a manufacturer purported precision of less than 2cm horizontally and 5cm vertically [15].
Leica FlexLine TS02 Total Station
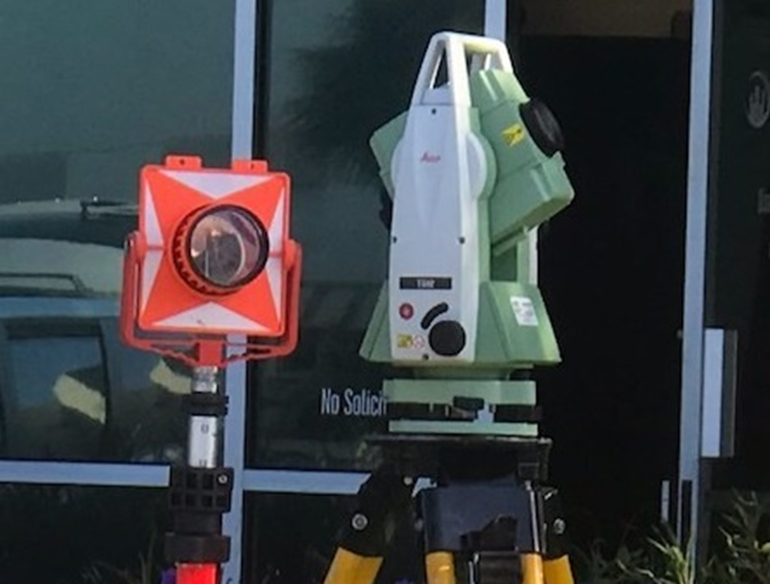
Leica’s FlexLine TS02 is a laser total station theodolite capable of measurements in multiple electronic distance measurement (EDM) modes, including prism and reflectorless. The TS02 is accurate to within 5 minutes of angle. For the purposes of this research, a CST/Berger prism was used with a monopole for all measurements (Figure 3).
DJI Mavic 2 Pro Small Unmanned Aircraft System
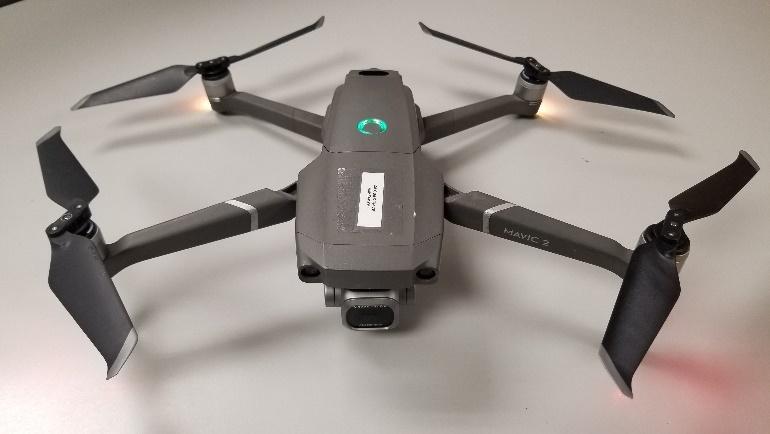
At the time of testing, several small Unmanned Aircraft Systems from numerous manufacturers were available for review. While sUAS can be equipped with a variety of camera payloads which could affect the resulting point cloud data, such as thermal and RGB cameras, the scope of this research merely required an RGB camera capable of taking high-resolution imagery. It was not dependent on which sUAS platform was chosen. Previous research by Carter [11] identified the differences in point cloud quality among several camera equipped aerial vehicles. For this research a DJI Mavic 2 Pro that suited the needs of the testing was chosen from Carter’s list. The DJI Mavic 2 Pro is equipped with a 20-megapixel camera, a one-inch sensor, and has a field of view of 77 degrees. The camera specifications, safety features, portability, and compatibility with multiple mapping software applications made it a suitable option for this research (Figure 4).
The DJI Mavic 2 Pro was flown via a remote controller through a DJI Pilot application. DJI Pilot is a free-to-use flight control application produced by DJI Technology for use with their DJI aircraft. Complex flight patterns, such as aerial mapping, can be predefined within the application and uploaded to compatible DJI drones. These flight patterns set boundaries and waypoints that optimize the drone mapping. These flight plans can be exported as KML files and shared with other users and devices, providing means for repeatable data collection.
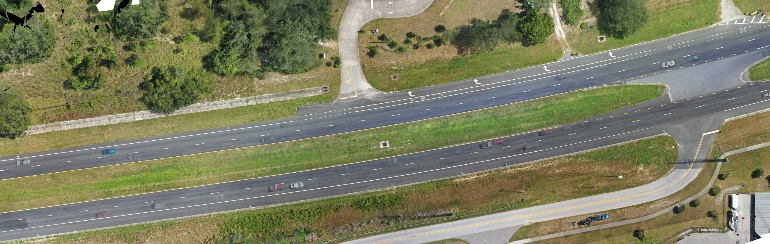
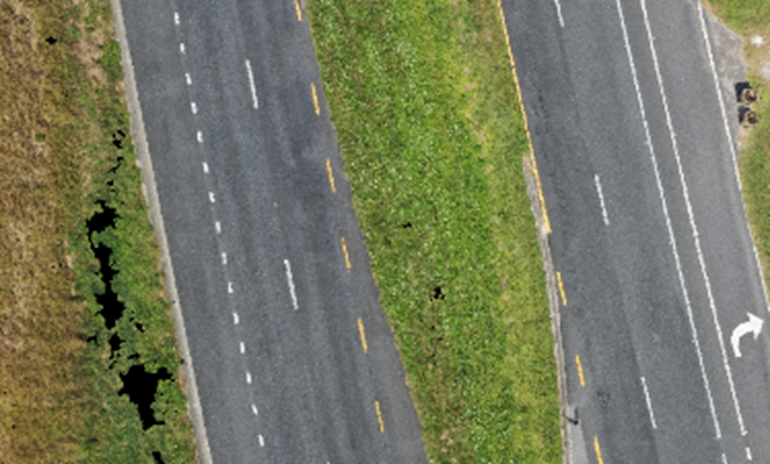
Testing was performed on a four-lane divided highway in Groveland, Florida. The location was chosen for its roadway features, elevation change, the low volume of traffic, and safety considerations of the participants. The roadway contained typical features commonly seen in accident reconstruction, such as separated travel lanes with dashed and solid lane lines, dedicated turn lanes, an intersection, bicycle lanes, and sidewalks. A section of the roadway approximately 900 feet long and 120 feet wide was utilized for testing. The roadway was sloped from north to south at a grade of approximately 3% in the area tested. Figure 5 is an aerial view from the sUAS of the site chosen for testing. The image has been rotated such that North is to the left.
The open area surrounding the roadway was ideal for testing. The location offered a direct line-of-sight to the UAV throughout the testing. Satellite signal for the Emlid and AeroPoint receivers was unobstructed. Ground control points were marked with temporary paint at 250’ intervals along the travel lanes on both the northbound and southbound shoulders so that placement of AeroPoint markers could be consistently measured and monitored. A Leica Total Station was positioned at the highest elevation of the roadway on the southwest shoulder of the road.
As a baseline comparison to the quality of mapped data from drone scan techniques, 28 data points were collected using a Leica Total Station. The mapped points represented typical objects that an accident reconstructionist would rely upon for generating scene diagrams. These 28 points are composed of white and yellow lane lines that make up the terrain of the roadway at varying elevations. In addition to the terrain and elevation mapped points, each AeroPoint was measured at the center of the board where the black and white squares converge. The Total Station measurements were captured to compare accuracy of RTK and PPK technology and are not required for use in generating point cloud data from sUAS.
For capturing aerial photographs, the Mavic 2 Pro sUAS was flown above the site using various automated flight patterns. The drone was flown at an elevation of 150 feet above ground level in order to be at an elevation high enough to clear vertical obstacles yet low enough to get detailed photos of the ground from the camera on the drone. The same launch position was used for each flight to maintain consistency between data sets. All operations were conducted in accordance with part 107 regulations of the Federal Aviation Administration by licensed sUAS pilots. The testing site was documented at an oblique camera angle of 60° and a nadir camera angle of 90° to the ground plane. Flight patterns within the DJI Pilot capturing application and camera orientation were adjusted between each flight to gather five varying data sets for analysis as depicted in Table 1.

To minimize discrepancies in data sets, all photographs were taken within 23 minutes from the first photograph to the last. During that time, sun and cloud coverage stayed consistent. Shadows from surrounding trees and structures were at an angle such that they did not cast onto the roadway [16]. The camera settings were set to automatic exposure and focused to the ground plane at the 150’ elevation of the camera. Minor variation in camera adjustments occurred during the data collection so that data was not removed from the image due to overexposure. Each .jpg photograph was verified for content after collection and before leaving the testing site.
Ground Control Point Coordinate Comparison
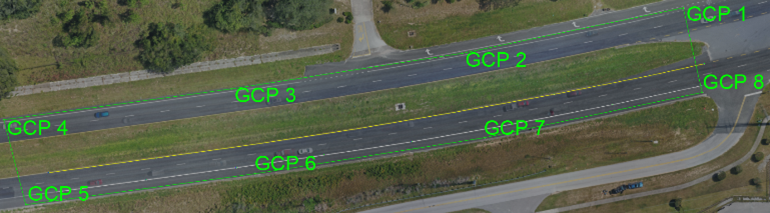
Ground control points were measured with three different methods while on-site. The first method, which was used as a baseline comparison for the other two methods, was Leica Total Station data. Twenty-eight measured points were collected at the scene with the total station and then processed through Carlson Survey [17]. Each ground control point location was listed as an X, Y, Z distance relative to the reference point where the Total Station equipment was positioned. The exported Carlson data was plotted in AutoDesk AutoCAD 2022 in its local coordinate system. An aerial was aligned to the plotted points and each ground control point was labeled for clarity. The resulting ground control point measurements, plotted in AutoCAD 2022, is shown in Figure 6.
After the Leica Total Station measurements were entered in AutoCAD, the ground control points from the Propeller AeroPoints were added as a comparison to the Total Station measured points. Because the Total Station measures and records relative distances from a reference point, and the AeroPoints measure and record distances of each ground control point as a geolocated position on the Earth, the data from the resulting AeroPoints needed to be translated for comparison to the Total Station points. The native X, Y, Z data from each AeroPoint were plotted in AutoCAD. Then the plotted X, Y, Z data from the AeroPoints was globally translated and rotated in AutoCAD to align a basepoint of the AeroPoints to a basepoint of the Total Station data. Upon analysis of the UAV photographs, the AeroPoint for ground control point number one (GCP1) had been relocated by a moving vehicle away from its marked position during the time that it was collecting data. Therefore, GCP1 was included in data sets, but not used as an accurate datum for further comparison. The AeroPoint data as X, Y, Z points were exported and compared to Total Station coordinates in Table 2.

With all of the ground control points from AeroPoints and Total Station sharing the same area, the relative distance between Total Station and AeroPoints could then be measured. Each ground control point was analyzed as separate X, Y, and Z values and the offset between the Total Station coordinate and AeroPoint coordinate was measured as a two-dimensional distance and a three-dimensional distance. Figure 7 shows the distance of offset between each ground control point.

Using the same global alignment process described previously between AeroPoint ground control points and Total Station measured points, the Emlid Reach ground control points were plotted in AutoCAD and aligned to the Total Station data. Table 3 lists the coordinates of measured data. Figure 8 is a distance comparison.


In addition to comparing the Total Station measurements to each of the GPS collection methods, the two GPS methods were compared to one another to analyze the deviation between their aligned positions. Ground control points from both methods differed within 1” of each other, shown in Figure 9.

Although the data sets from AeroPoints and Emlid needed to be translated to align to Total Station for comparison, the two GPS methods are recorded using the same geolocation; therefore, the data did not natively need to be translated or rotated for comparison to one another. Their geolocational data is shown in Table 4.

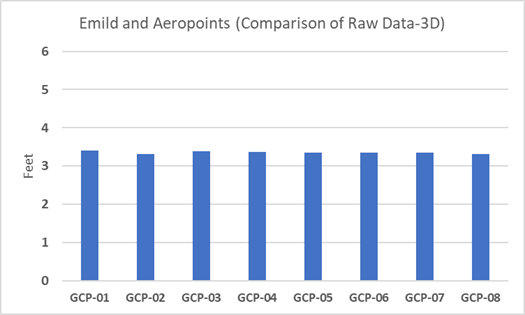
It is worth noting that site mapping for the purpose of accident reconstruction generally does not need exact geolocated coordinates to create an accurately scaled diagram. The local accuracy of coordinates to one another is more important than the overall geolocation on Earth. However, the data was available, so an analysis was made between coordinates from the real-time kinematic correction method to the coordinates derived from post-processing kinematics correction method. The coordinates from Emlid Reach and the coordinates from the AeroPoints deviated by a notable amount. The amount was consistently different and ranged from 3.3 feet to 3.4 feet between ground control points. The deviation was in the same direction for each point, so a global offset could be made to align both methods to a difference of 0.1 foot. The average 3D translation between each ground control point is illustrated in Figure 10.
Aerial Photograph Camera Angle Comparison
During the data collection process, aerial images were collected as five separate sets of photographs from five flight patterns. The Mavic 2 Pro drone used a modified flight pattern to collect data sets nadir (camera at a 90 degree angle to a flat ground plane) and oblique (camera at a 60 degree angle to a flat ground plane). The oblique images were captured in east, west, south, and north facing directions. The authors sought to analyze the effect that oblique photographs and nadir photographs had on the photogrammetric process. The images were separated into nadir photographs and oblique photographs and then processed as separate sets through the Pix4Dmapper photogrammetry software to generate a scaled point cloud representation of the scene. All images were then combined into a complete set of nadir and oblique photographs and processed into a third point cloud. The resulting point clouds from the three data sets were analyzed for their point count and visually compared for their coverage and consistency. Table 5 identifies the data sets and the resulting number of points that make up each point cloud.

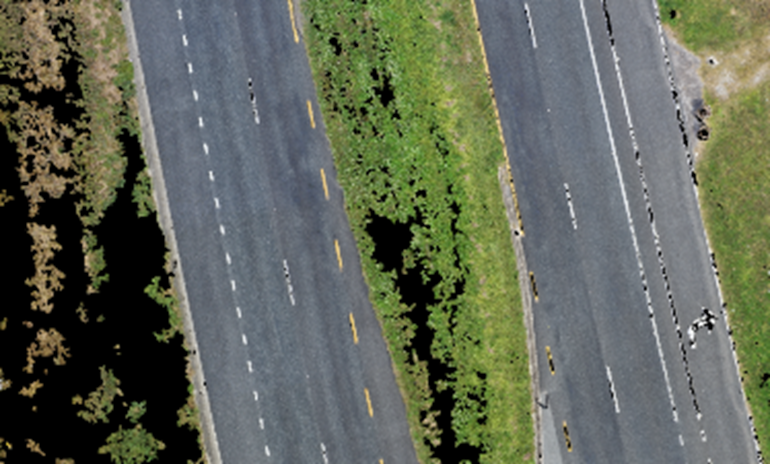
The point cloud data from the nadir-only images was lacking in coverage of certain parts of the roadway. Areas without a variety of pixel contrast, such as white lane lines and green grass, contained fewer data points than areas with higher contrasting pixels in the nadir-only point cloud. The point cloud data from oblique-only images did not have gaps in the roadway or as much of a gap in grass that the nadir-only point cloud had. A higher number of photographs depicting the roadway lines at different angles produced more coverage in the oblique-only point cloud. Photographing vertical features from an oblique angle also produced more points and coverage on vertical elements of the scene than did the nadir only point cloud. Evident gaps in point cloud coverage are displayed in Figures 11 and 12.
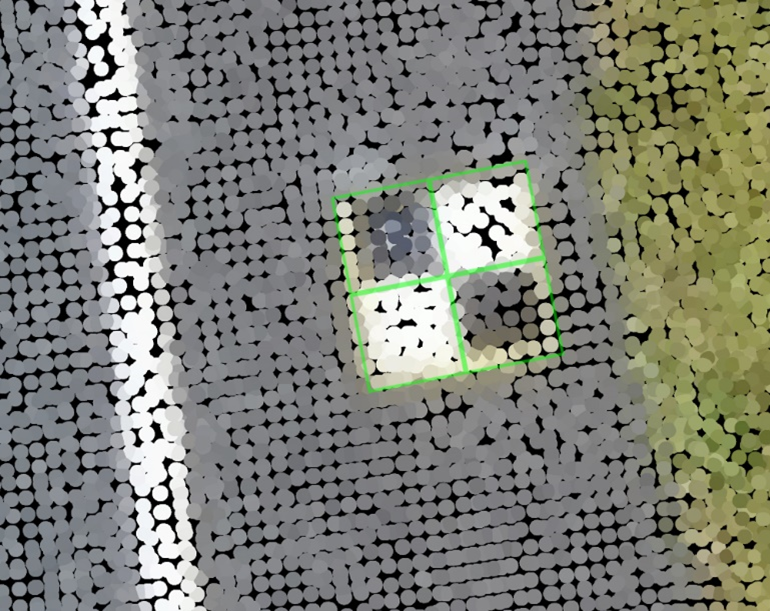
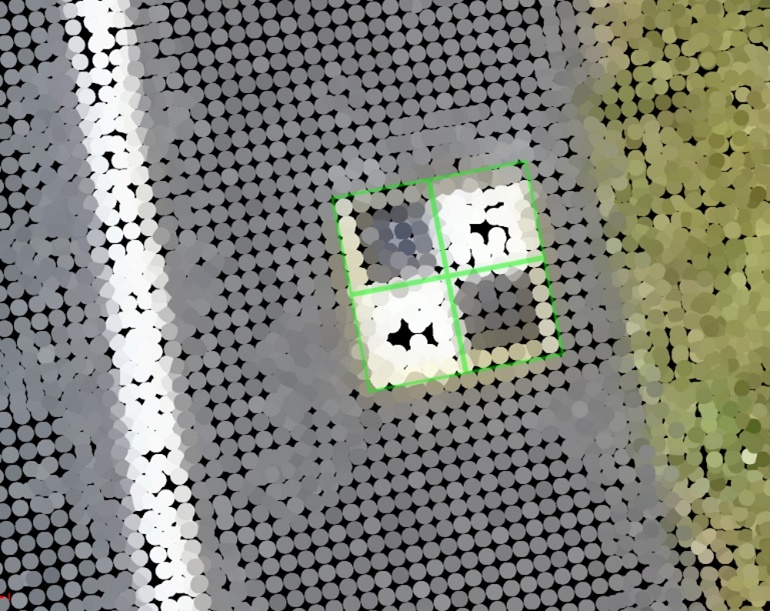
The complete set of processed photos with both nadir and oblique images were marginally different when compared visually to the oblique-only point cloud. The only noticeable visual difference was a slight angle to known parallel lines seen on the edges of AeroPoints. The inclusion of nadir photos also creates a more consistent linear patter of points throughout the scan. Figure 13 is an image showing the AeroPoint from the oblique-only data set with a green grid of parallel lines overlaid on the AeroPoint. Figure 14 is the same green grid overlaid on the point cloud from the combination of nadir and oblique photographs used during processing.
Ground Control Point Photoscanning Comparison
Ground control data is utilized directly in scaling and orienting the point cloud while processing aerial photographs in photogrammetry software. The two GPS data sets, AeroPoint PPK and Emlid Reach RTK, were each used in Pix4Dmapper as a component in the photogrammetric process [18]. The combined 439 oblique and nadir photos taken by the Mavic 2 Pro at 150 feet above ground level were initially processed in Pix4Dmapper and then saved as a template. The template was then used as the basis for the two different ground control point data sets.
The first set of data used with the Pix4Dmapper template was the Emlid Reach ground control points. The Emlid Reach GCPs were taken in a NAD83 (2011) datum with Florida East coordinate system. The second set of data used on the Pix4Dmapper template was the Propeller AeroPoint GCPs. Its coordinate system was the same as the Emlid Reach coordinate system (NAD38 (2011) Florida East). A separate file was saved for the RTK processing and the PPK processing. Identical methodology was then used for each file to complete the point cloud processing.
For each file, ground control points were visually marked in photographs to geolocate the coordinates. The coordinates from ground control points aid in the scale and orientation of the final point cloud. The point cloud data then was processed by the Pix4Dmapper software. The resulting Emlid Reach RTK and Propeller AeroPoint PPK point clouds, were brought into AutoDesk Recap to convert the points into an RCS file which then was imported into AutoDesk 3DS Max for comparison [19, 20]. The point clouds were aligned together using the same reference points for translation and orientation that were used with the Total Station measured ground control points mentioned earlier. Deviation between the ground control points had already been measured through previously discussed methods. Therefore, analysis was done on areas not formerly compared.
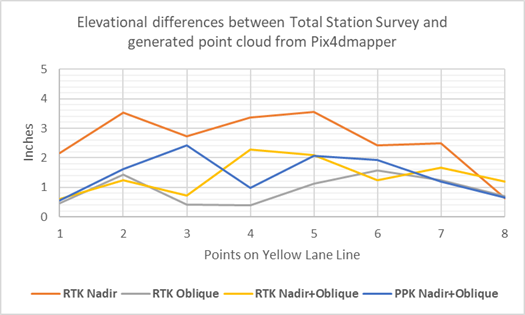
Since elevational changes are the most notable discrepancies seen in photoscanning point cloud data sets, an analysis was done on the range of error between points interpolated from ground control point pairs. The Total Station data was used as the baseline for elevational points. Eight points along the yellow lane line of the road were mapped using the Leica Total Station. Their distance from each ground control point and proximity to the median were ideal coordinates for comparison to the Pix4Dmapper photoscans. The eight measured points are shown in Figure 15 on an aerial image from the drone on the day of testing.
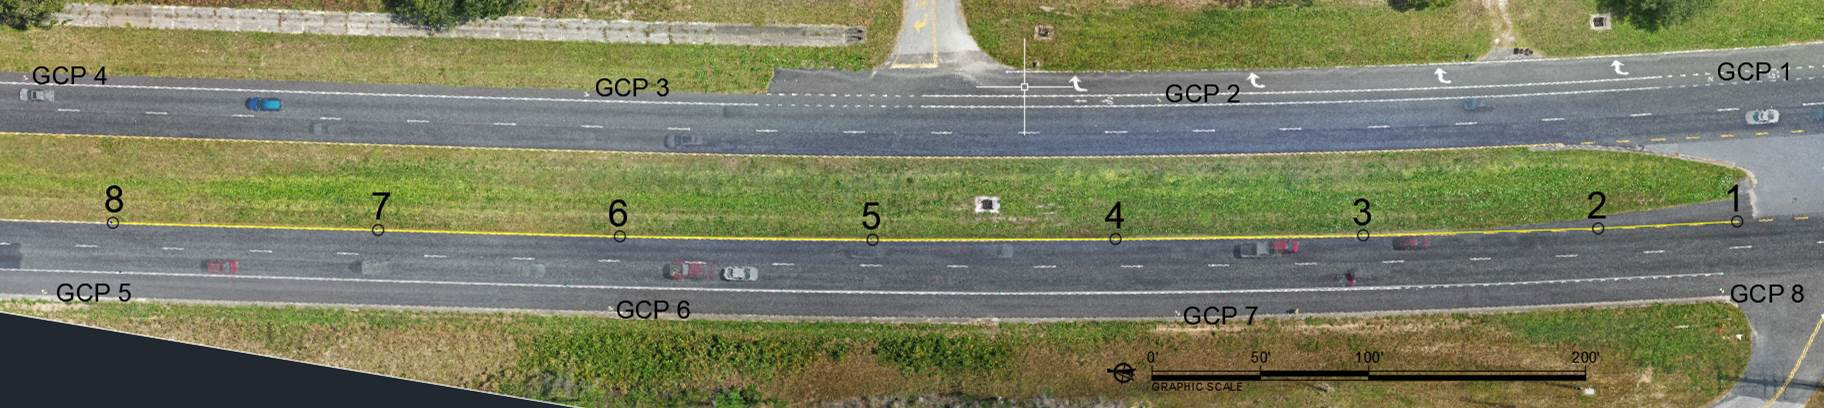
The eight mapped points were identified as horizontal points along the yellow lane line in each of the Pix4Dmapper photoscans. With the horizontal measurements being nearly identical to the Total Station points, they were analyzed from a vertical perspective. Maximum variance in elevation from each of the RTK enabled point clouds in the analyzed area was measured to be less than 2” from Total Station points. Maximum variance in elevation from each of the PPK enabled point clouds in the analyzed area had a slightly higher variance but measured less than 2.5” vertical from Total Station points. As an additional element of comparison, the processed point cloud from the previously processed nadir-only images and the oblique-only images were included in the comparison. This analysis is shown in Figure 16.
Global Position Accuracy of RTK and PPK
Differing GPS correction methodology of Real-Time Kinematic correction and Post-Processing Kinematic correction produced a nearly uniform offset of approximately 3.3 feet between the two correction methods. Since the Total Station measured points did not produce geolocated coordinates, comparing the RTK and PPK techniques to Total Station survey does not reveal which GPS processing method is most accurate. Future research could clarify whether the offset seen between RTK and PPK testing is typical of varying correction matrices or whether it is unique to this test.
Local Position Accuracy of RTK and PPK Systems
Accident reconstruction methods generally rely more upon positional accuracy between local points versus an exact geolocation on Earth. Therefore, the 3.3 foot offset seen between RTK and PPK methods is negated by their accuracy after alignment to a common point. Ground control points taken from GPS enabled devices with both Real-Time Kinematic technology and Post-Processing Kinetmatic technology are comparable to Total Station measured points to within 1-inch.
Photoscanning with RTK and PPK Systems
The accuracy of RTK and PPK techniques is beneficial in the photoscanning process of combining nadir and oblique photographs taken at a site with a sUAS. Processed photoscans with RTK ground control points were within 2.2-inch vertical distance and 1-inch horizontal distance of Total Station surveyed points. Processed photoscans with PPK ground control points were within 2.4-inch vertical distance and 1.5-inch horizontal distance of Total Station surveyed points.
We would like to thank Toby Terpstra, Nathan McKelvey, Charles King, Steve Mitchell, and Alireza Hashemian for providing insight and expertise that greatly assisted in this research.
Toby Terpstra is a Senior Visualization Analyst in J.S. Held’s Accident Reconstruction Practice. He specializes in 3D analysis, site reconstruction, photogrammetry, video analysis, visibility, interactive media, and 3D visualization. He is currently the lead instructor of an ACTAR accredited course offered by the Society of Automotive Engineers titled “Photogrammetry and Analysis of Digital Media”. Mr. Terpstra has also taught and conducted research on topics such as onsite photogrammetry, photoscanning, video analysis, videogrammetry, lens distortion, LiDAR, body-worn cameras, trajectory rod documentation, acoustics, and 3D visualization.
Toby can be reached at [email protected] or +1 303 733 1888.
Nathan McKelvey is a Visualization Analyst in J.S. Held’s Accident Reconstruction Practice.
Nathan can be reached at [email protected] or +1 303 733 1888.
Charles King is a Senior Technician in J.S. Held’s Accident Reconstruction Practice. Mr. King applies his educational experience in mechanical engineering and more than 10 years of experience within the automotive field to the reconstruction of traffic accidents. Mr. King’s areas of expertise include vehicle dynamics, failure analysis, automotive diagnostics and repair, shop management, and 12V systems. Mr. King is skilled in scene investigation, evidence collection and analysis from vehicles and sites, laser metrology, video analysis, photogrammetry, and engineering dynamics analysis. He has investigated and assisted in the reconstruction of complex crashes involving multiple vehicles, heavy trucks, pedestrians, bicycles, and motorcycles.
Charles can be reached at [email protected] or +1 407 707 4986.
Steve Mitchell is a Senior Engineer in J.S. Held’s Accident Reconstruction Practice. Dr. Mitchell has extensive experience in the areas of traffic engineering, electrical engineering, traffic accident reconstruction, and product failure analysis. He has designed signalized intersections; developed, implemented, and evaluated traffic signal timing plans and traffic signal system installations; and evaluated highway-rail grade crossings and systems. As an engineering consultant, Dr. Mitchell applies his engineering education and experience to the forensic evaluation of losses involving electrical failures of industrial and consumer products, traffic accident investigation and reconstruction, and traffic signal operation.
Steve can be reached at [email protected] or +1 407 707 4994.
[1] Danaher, D., Donaldson, A., and McDonough, S., "Acceleration of Left Turning Heavy Trucks," SAE Int. J. Adv. & Curr. Prac. in Mobility 2(4):2019-2036, 2020, https://doi.org/10.4271/2020-01-0882.
[2] Carter, N., Beier, S., and Cordero, R., "Lateral and Tangential Accelerations of Left Turning Vehicles from Naturalistic Observations," SAE Technical Paper 2019-01-0421, 2019, https://doi.org/10.4271/2019-01-0421.
[3] Young, C., King, D., and Siegmund, G., "SUV Kinematics during a Steer-Induced Rollover Resolved Using Consumer-Grade Video, Laser Scans and Match-Moving Techniques," SAE Technical Paper 2020-01-0642, 2020, https://doi.org/10.4271/2020-01-0642.
[4] Funk, C., Petroskey, K., Arndt, S., and Vozza, A., "Vehicle-Specific Headlamp Mapping for Nighttime Visibility," SAE Technical Paper 2021-01-0880, 2021, https://doi.org/10.4271/2021-01-0880.
[5] Rose, N., Carter, N., Neale, W., and Mckelvey, N., "Braking and Swerving Capabilities of Three-Wheeled Motorcycles," SAE Technical Paper 2019-01-0413, 2019, https://doi.org/10.4271/2019-01-0413.
[6] Bortles, W., Koch, D., Beauchamp, G., Pentecost, D. et al., “Event Data Recorder Performance during High Speed Yaw Testing Subsequent to a Simulated Tire Tread Separation Event,” SAE Technical Paper 2019-01-0634, 2019, doi:10.4271/2019-01-0634.
[7] Beauchamp, G., Pentecost, D., Koch, D., and Bortles, W., "Speed Analysis of Yawing Passenger Vehicles Following a Tire Tread Detachment," SAE Int. J. Adv. & Curr. Prac. in Mobility 1(3):883-917, 2019, https://doi.org/10.4271/2019-01-0418.
[8] “Surveying & Mapping.” GPS.gov: Survey & Mapping Applications.https://www.gps.gov/applications/survey/, accessed Oct 2021
[9] Department of Defense, “Global Positioning System Standard Positioning Service Performance Standard”, 5th Edition, April 2020
[10] van Diggelen, F. and Martin, W., "Dual-System RTK, Centimeter-Accurate Positioning," SAE Technical Paper 972785, 1997, https://doi.org/10.4271/972785
[11] Desai, E., Wang, P., Suway, J., and Engleman, K., "Bicycle GPS Positional Accuracy," SAE Technical Paper 2021-01-0878, 2021, https://doi.org/10.4271/2021-01-0878.
[12] Carter, N., Hashemian, A., and Mckelvey, N., "An Optimization of Small Unmanned Aerial System (sUAS) Image Based Scanning Techniques for Mapping Accident Sites," SAE Int. J. Adv. & Curr. Prac. in Mobility 1(3):967-995, 2019, https://doi.org/10.4271/2019-01-0427.
[13] National Aeronautics and Space Administration, “Global Navigation Satellite System (GNSS) Overview”, https://cddis.nasa.gov/Techniques/GNSS/GNSS_Overview.html, accessed Oct 2021
[14] Propeller, “How PPK Works – And Why It’s the Future of Drone Surveying”, https://www.propelleraero.com/blog/how-ppk-drone-surveying-works/, accessed Oct 2021
[15] Propeller,“AeroPoints,” http://www.propelleraero.com/aeropoints/, accessed Oct 2021.
[16] Global Monitoring Laboratory, “NOAA Solar Calculator”, gml.noaa.gov/grad/solcalc/, accessed Oct 2021
[17] Carlson Survey (2012), Computer Software, Carlson Software, United States of America, http://www.carlsonsw.com
[18] Pix4Dmapper (Version 4.6.4), Computer Software, Pix4DSA, Switzerland, https://pix4d.com/
[19] Carter, N., Hashemian, A., Rose, N., and Neale, W., "Evaluation of the Accuracy of Image Based Scanning as a Basis for Photogrammetric Reconstruction of Physical Evidence," SAE Technical Paper 2016-01-1467, 2016, doi:10.4271/2016-01-1467.
[20] AutoDesk Recap 2022, Computer Software
[21] AutoDesk 3DS Max 2022, Computer Software
This paper presents a methodology for utilizing publicly available LiDAR data from the United States Geological Survey (USGS) in combination with high-resolution aerial imagery to establish GCPs based on preexisting site landmarks. This method is...
Ground-based Light Detection and Ranging (LiDAR) using FARO Focus 3D scanners (and other brands of scanners) are repeatedly shown to accurately capture the geometry of accident scenes, accident vehicles, and exemplar vehicles, as well as...
Approaching an intersection and braking to a stop, as well as accelerating from a stop, is a common occurrence in daily life. While the experience is routine, the actual rate of deceleration and acceleration has...