Insights
J.S. Held Acquires Shechter & Everett to Expand Forensic Accounting Capabilities for Family Law Disputes in Florida
Read MoreWinter weather is a challenge for all of us, especially those who predict it. Whether in a snow-prone area or one that receives only a few inches of snow per year, this time of year presents more hazards for meteorologists to assess and forecast.
In the warmer season, an isolated light shower (particularly at night) could easily go unnoticed as this type of weather carries negligible impact for so many. However, that same isolated light shower in January could become a quarter to a half inch of snow or a glaze of ice.
Lowered predictability on roads and in traffic is the first problem. In Iowa, for example, weather-related crash statistics between 2018-2020 show that around 56% of weather-related crashes occurred with an inch or less of snowfall. Of those, around 21% occurred with just a trace of snowfall. [1] Add in the slips/falls on the sidewalks, potentially delayed schools, and aggravated drivers, and this small amount of moisture has greatly impacted the day. And that is just the start of the day. We have yet to consider early class dismissals, cancelled extracurriculars, or road conditions in the latter part of the day.
In this article, we will briefly discuss the process of forecasting snow, where you can find the most trustworthy sources of snowfall information, and how to properly measure and report snow. The following information may be of particular interest to transportation companies, school districts, and any entity who may be affected, either positively or negatively, by the presence of fallen or falling snow.
Forecasting snowfall is a complex process. To produce a snowfall forecast, meteorologists must analyze:
The process of forecasting snow can be rather lengthy given the effort needed to analyze these variables and how easily one of them can affect the eventual outcome. Consider snow-to-water ratio as an example. The adage of a 10:1 snow ratio (10” of snow = 1” of rain) is only correct about 25% of the time, and the amount of ice in the cloud, wind, lift and temperature all affect snow ratios. [2] If a meteorologist is predicting a 10:1 ratio with a moisture content of 0.5”, the resultant snowfall forecast would be around 5.0”. However, should the temperature, wind, lift, or any combination of the above change from the forecast issuance to the onset of precipitation (which usually happens), the ratio could, for example, become 14:1 with little or even no advanced notice. With the same amount of moisture, the resultant snowfall would be around 7.0” versus the originally predicted 5.0”.
Aside from all the other variables discussed above, the dendritic growth zone (DGZ) is important to understand, affecting ice crystal type (snow), shape, and density.
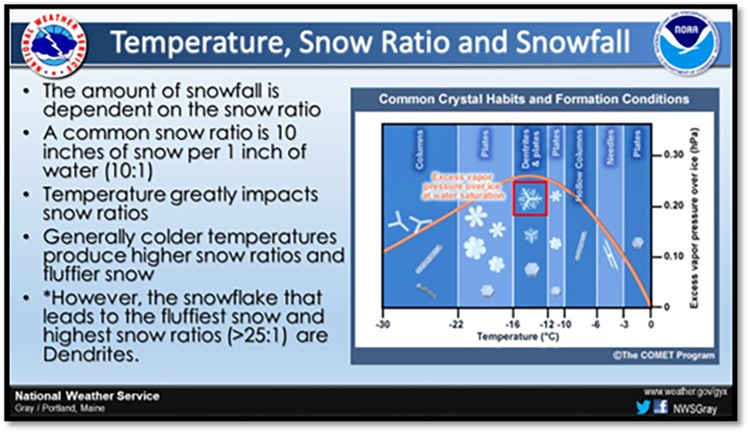
Figure 1: Temperature, snow ratio, and snowfall graphic from the Gray/Portland, Maine National Weather Service (Source: NOAA).
Generally, the atmosphere will cool as altitude increases. Depending on what altitude the saturation occurs and how deep (or thick) that saturated layer is, a variety of snow crystal shapes and sizes are possible. The general sweet spot is sufficient saturation (relative humidity ≥70%) within the -12°C and -18°C layer. [3] Within this layer (provided adequate lift and saturation), plates (six-sided crystals) and dendrites (tree-like structures) are most common and tend to have the most air in between the branches, allowing for efficient snow accumulation.
Most snowfall forecasts will contain predicted timing, location of predicted snow/ice bands, and a general confidence level. These can be freely obtained from the National Weather Service and most local media outlets on a variety of digital platforms. An example of a snowfall forecast by the National Weather Service in Davenport, Iowa, is shown below. Additionally, you can enhance your understanding of snowfall forecasting by exploring resources from professional forensic meteorologists.
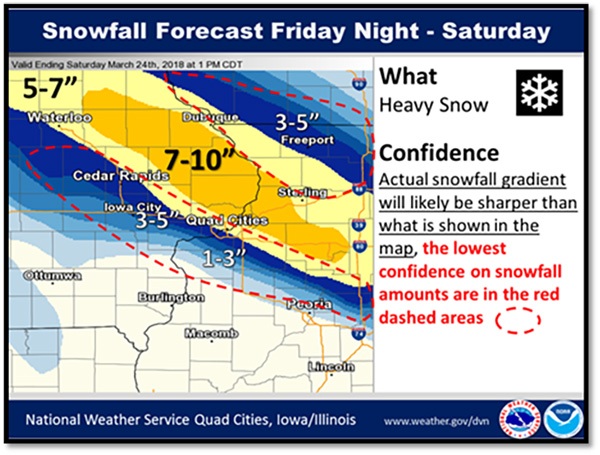
Figure 2: Snowfall forecast from the Quad Cities National Weather Service office (Source: NOAA/NWS Quad Cities).
Model data is used when creating these snowfall forecasts. This model data is crucial to the accuracy of the forecast, provided there is some human processing of the data. A meteorologist may want to rely heavily on a particular dataset and/or exclude another one as it may be a significant outlier. These models are generally initialized once every six hours (some of them every hour), and even from one initialization to the next, models may be drastically different. Sometimes, a storm can be present on a dataset only to be gone a couple of days later. The example below is from the ECMWF model, presented via Pivotal Weather. The image on the left was initialized on Tuesday, December 6th, 2023, valid for snow potential on Saturday, December 9th, 2023. The image on the right is from two days later, Thursday, December 8th, 2023, valid for the same time. In a short time, the storm has gone.
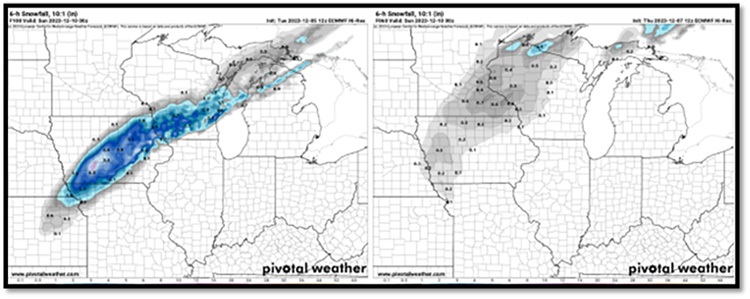
Figure 3: Example of model data changing drastically. On the left, initialized Tuesday morning, December 5, 2023. On the right, initialized Thursday morning, December 7, 2023. Both images are valid for Saturday, December 9, 2023 (Source: Pivotal Weather/ECMWF).
This happens behind-the-scenes with nearly every winter storm, and meteorologists do their best to try to navigate this issue, offering a balance between consistency and accuracy, as well as transparency.
Always consider the source of a snowfall forecast, especially when making plans based on it. If the source of information is a local television meteorologist, local television website/app, or anything from the National Weather Service, the information is generally trustworthy. If the snowfall forecast is coming from something other than those sources, it is important to assess the trustworthiness of the source and ensure that the info is not coming from clickbait-style websites or blogs that may create “hype” for a winter storm simply for advertising revenue or page views.
How things change over time should also be addressed. The further out a forecast is issued, the more error-prone it is. It is advisable to check the forecast provider of your choice frequently, particularly when planning for travel, outdoor activities, outdoor events, and the like. Both television and National Weather Service meteorologists can typically issue more accurate forecasts the closer the date of interest. The graphic below offers a good way to imagine these longer-range forecasts. And no, long-range forecasting is not 100% like the analogy in the graphic, but it can sometimes seem to be.
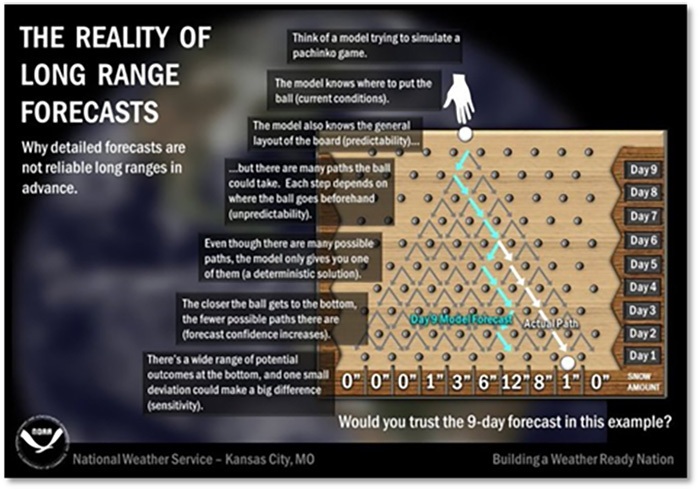
Figure 4: An illustration of the reality of long-range snowfall forecasts (Source: NOAA).
Once an event is over, we always want to know, “How much snow did we get?” Per the Snow Measuring Guidelines for National Weather Service Surface Observing Programs, some important and relevant terms are defined below [4]:
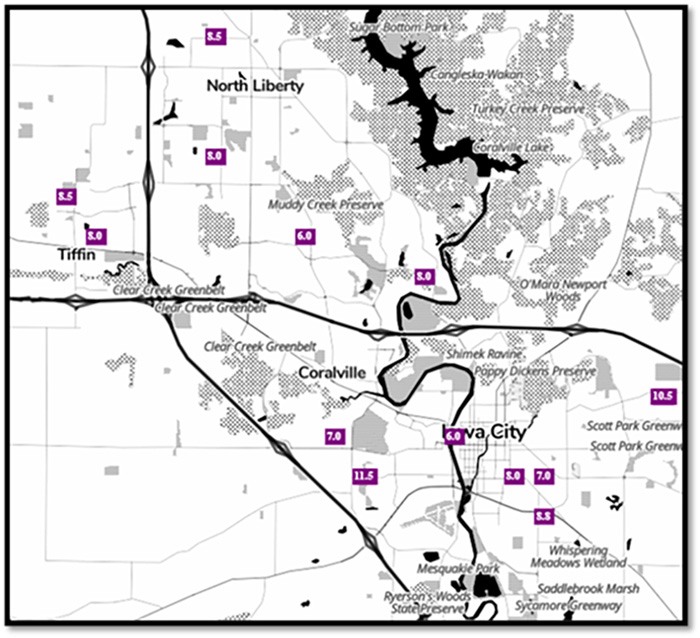
Figure 5: Snowfall totals plotted on a map (Source: Iowa Environmental Mesonet).
It is essential for all observers to understand the importance of consistent and standard measurements. A snow measurement board (SMB) is recommended to accurately measure snow, located away from trees and buildings. In the absence of a SMB, a 24” by 24” piece of exterior or marine-grade plywood, painted white, can be substituted.
It is common snow observation procedure, as outlined by the National Weather Service, to:
Weather enthusiasts, young or old, may wish to consider becoming a Community Collaborative Rain, Hail & Snow (CoCoRaHS Network) spotter. [5] It is free to join, and those who do join help the National Weather Service and television meteorologists alike with timely and localized reports of snow.
Winter weather is complicated, but we have now made clearer the numerous efforts that are needed to get a snowfall forecast correct. We have also highlighted where trustworthy sources of information reside and the importance of staying on top of accurate forecasts. By doing so, businesses can minimize the pitfalls of misinformation, avoiding unneeded stress and, possibly, unneeded expenses. Whether planning or anticipating travel or other affected activities, it is advisable to identify and connect with a trusted source for snowfall forecasts and to always check whether there is human analysis supporting the final product.
We would like to thank our colleague Kaj O’Mara, CCM, CBM, for providing insight and expertise that greatly assisted this research.
Kaj O’Mara is an Assistant Chief Meteorologist II in J.S. Held's Forensic Meteorology service line. He is a Certified Consulting Meteorologist (CCM) with over 16 years of experience in operational meteorology. An elite communicator with dual meteorology certifications, Mr. O’Mara brought his expertise in severe weather to over one million residents across eastern Iowa during his tenure as an Emmy Award-winning Certified Broadcast Meteorologist (CBM). Throughout his tenure in the broadcast industry, Mr. O’Mara’s expertise in a wide range of hazardous and impactful weather were widely utilized by the agricultural and transportation industries, as well as revered by numerous school districts, college campuses, and sports teams. Mr. O’Mara routinely employed his role as a National Weather Service Weather Ready Nation Ambassador across numerous municipalities, school districts, and emergency management sectors.
Kaj can be reached at [email protected] or +1 319 250 7797.
Winter is complicated whether we are judging the start or stop time of a winter event, the type of precipitation that has occurred, or the amount of accumulation. This article references numerous peer-reviewed studies regarding...
Consulting with a professional meteorologist regarding reported (or conversely, unreported) storm events is fundamentally crucial to understanding a storm’s occurrence (or lack thereof) for insurance claims. Find out why....
The term “ice dam” refers to the damming of water behind an accumulation of ice buildup along the eaves and/or valleys on a roof covered with snow. Heat loss from the home or building into...